When you think of a digital scholarly tool you might think of Google Scholar, Evernote or something along that line, however there are so many other tools out there that can help you in different ways with your scholarly needs. For my Digital Humanities class I were asked to find a digital scholarly tool that would be useful for my own future research, play around with it and review it to see what conclusions I came to. The tool I chose to review is WorldMap. WorldMap is a digital tool that allows you to display, create, research spatial data and other data forms on a web platform which is run by the people at the Geographical Analysis in Harvard University. Its aim is to give people a platform to visualise, create and research projects without having to be an expert in Geographical Information Systems (GIS). I have always enjoying exploring maps and been presented with information in this visual manner, so this site was something that I wanted to explore and learn more about. And I did just that.
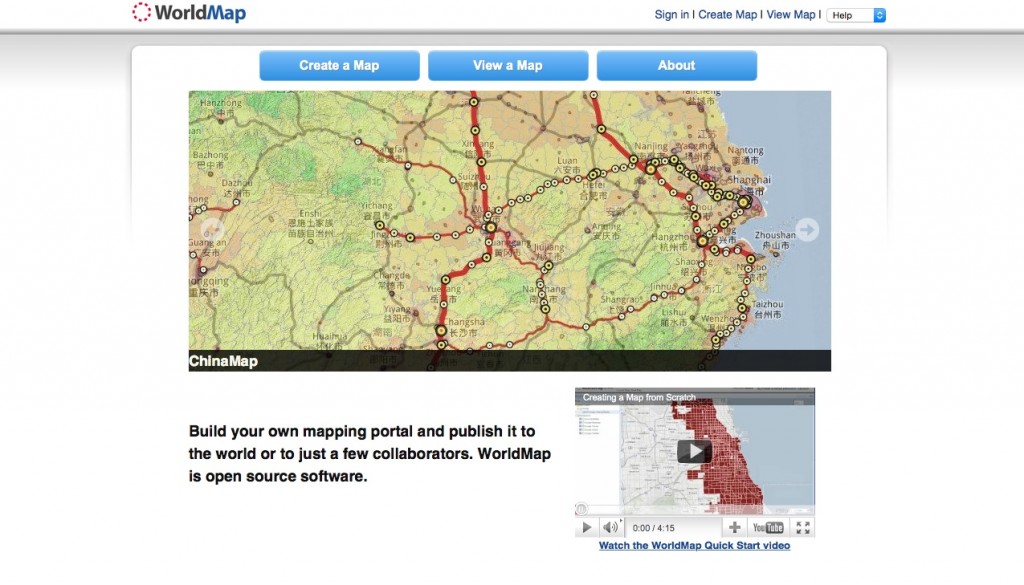
WorldMap homepage
When looking for an idea for a scholarly tool to explore, I wanted it to fill two criteria. The first criterion was for the tool to be open source, since starting my studies in Digital Humanities I have found many benefits to the open source platform and a lot of useful tools being developed by smart and innovative communities. The second was I wanted something that explored data visualisation, seeing the creative ways people can visualise data is something I find interesting and an area I would like to learn more about. I looked through the Digital Research Tool Directory (DiRT) to get an idea of the types of digital tools available out there and to see how comprehensive the list was. I was surprised to find the list of tools very detailed and an extensive range of areas of work available, with links to places where you can download or access the digital tool. It is a useful place to go to find what is available out there. My intention was to find a tool that was not on the DiRT Directory and one I could add to the list. I searched the internet for information on interesting open source digital visualisation tools, and find one that would be easy to use and fun to play with. I found a few articles listing the top tools in certain areas and fields and a Wikipedia page that listed all open source digital tools available. It was good to see so many open source tools available for use by all. As I searched through many articles on different open source digital tools and found that most tools I came across were already in the DiRT Directory. I found one article which reviewed WorldMap that mentioned that it was a very useful mapping and visualisation tool for beginners (Lawson, Konrad M., 2012). From there I accessed the site and started playing around with WorldMap. On my first check to see if WorldMap was already on the DiRT Directory I must have made a mistake in typing it in the search bar, as it came up negative twice. It was only when I tried to enter it into the DiRT database that I found out that it was already added, but I decided to continue with my review as it was a tool I liked.
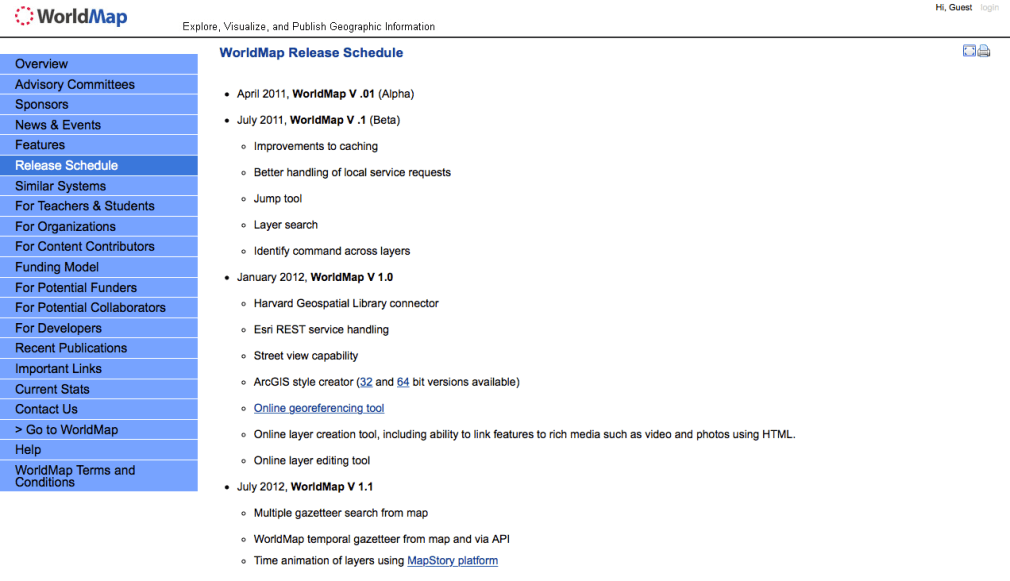
The about section in WorldMap that contains all the information on the tool
WorldMap uses the website platform to run its digital tool on, however it also contains a manual, tutorial videos and other information for developers, contributors, teachers, students, organisations and history of version releases. Currently WorldMap is on version 2.4, which was released in December 2015. The first alpha version, v0.1, was released in April 2011, with the beta version following in July 2011. In January 2012 version 1.0 was released to the general public, since then there has been six different version of the tool. I have been playing around with WorldMap for a few days and while learning to use some of the features, the first thing I noticed was that it’s not the most aesthetically pleasing. The selection of different maps is great and you can present your data with the use of many visually pleasing maps. However the menus and information boxes could have been presented better, also the functionality for creating maps and different layers could have be made simpler to use. While looking through the different menu options some of them were not clear and were misleading to what they do. It was only after I watched a couple of tutorial videos that I understood how to create basic layers. After watching some tutorials I was all set and full of the knowledge needed to create my first map. I decided to make a map that linked songs written about cities and present them on the map with a video of the song embedded to the location. Unfortunately this did not go to plan. I followed every step in the tutorial videos, however as I went to save my location link onto the map an error appeared stating I could not save and it was a “read only file”. After many attempts of trying to make it work I e-mailed WorldMap support with my problem. Within two days they had e-mailed me back saying the problem was fixed and I was good to go again. After that there were no problems and I could start adding data and videos to my map. There are still a lot of features of WorldMap I need to get my head around, like learning more about how to extract data from other sources and present it on WorldMap in a project. But for now I can make basic maps and share with people.
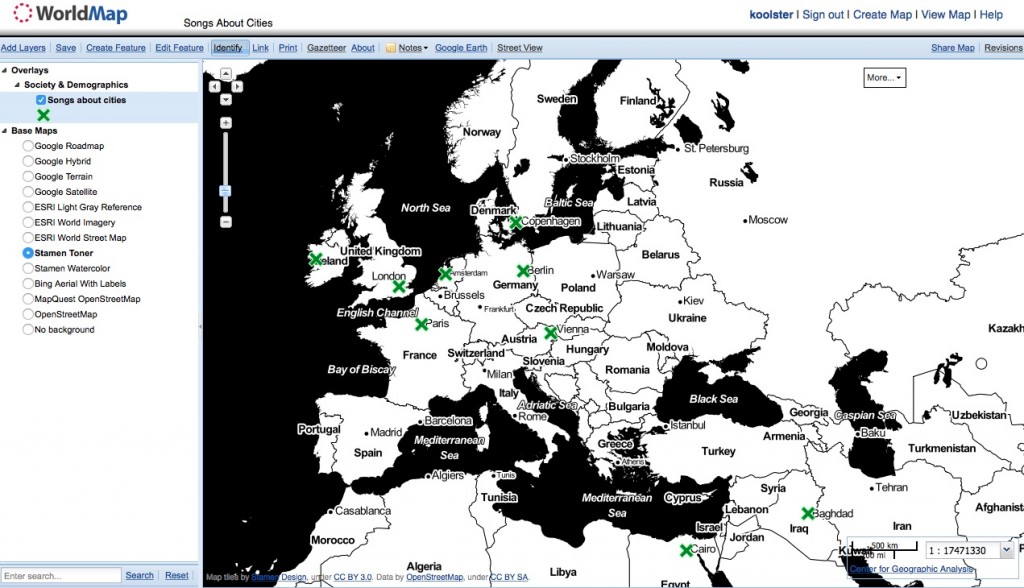
Map of ten songs written about famous cities
WorldMap appears to be growing and with the release of v 2.4 last month, they are actively trying to improve the product and get more people using it. On their website you can find current stats on how it is performing, how many people are using it and how many maps have been created. To date they have over one million unique visitors to their site, about one thousand visitor per day, over 15,000 registered users and nearly 6,000 map collections created. It seems as though there is a growing community that like using this tool. The fact that it is an open source digital tool that anyone can contribute to is very appealing and will only improve it in the future. One area that it might be lacking in options is exporting or extracting data. There were only three ways that I could find to share your data, the first is, you can embed the map on your blog. This method did not work for me, I wanted to display my map on this post to for easy access to my map. This problem is not on WorldMap, as I have encountered this with my WordPress blog and embedding before. Instead I just took a screenshot of the map and made it a clickable link to my project on the WorldMap site, which is the second way of sharing your data. The third way is you can print the map out in paper form, which might seem a bit old-fashioned but I find it is a nice way of looking at maps. The only problem with printing it out is that you lose the interactivity of turning parts on and off and zooming in and out on specific areas. It would be nice to have a few more options to export the map into specific file formats, be able to take it off the WorldMap site and use it with other programs. For now these seem to be the only three ways to distribute the data.
For research purposes WorldMap could be useful for visualising your data on a map and adding images and videos to your work to add dimension to your work, however I found that a beginner would need to learn a lot more about geo spatial data and other tools to get the best out of WorldMap. With a bit more playing around with the site and watching more tutorials I believe it would be possible to learn to use it in a beneficial way for any future research. With WorldMap being open source and easy to share online, it is easy to point people to your work and for them to study it in their own time. To conclude WorldMap is a nice open source mapping tool that with a bit of patience you can learn how to use and incorporate it into your own research. The functionality and aesthetic look could be worked on but after a troublesome start I got it working and can now to use it as a tool to visualise my data in map form.
Bibliography:
- Lawson, Konrad M. “Using the WorldMap Platform.” The Chronicle of Higher Education Blogs: ProfHacker, March 14, 2012. http://chronicle.com/blogs/profhacker/using-the-worldmap-platform/38992.
- “WorldMap – Wikipedia, the Free Encyclopedia.” Accessed January 28, 2016. https://en.wikipedia.org/wiki/WorldMap.
- “Welcome! – WorldMap.” Accessed January 31, 2016. http://worldmap.harvard.edu/.
Leave a Reply